The blueprint for highly available systems: Active-Active Architecture in Banking on Google Cloud
A non-disruptive service is essential in the banking sector, where strict compliance requirements, security restrictions and limited access to certain Google Cloud services add a level of complexity that can be difficult to achieve in
How to recognize and correct errors in development cycles with "Shift Left"
Every second counts in software development. Errors that are discovered late cost time, money and sometimes even the trust of customers. This is where the "Shift
Jira Service Management News from Atlassian's High Velocity Event 2023
The Atlassian community recently met at the High Velocity event in Sydney. At the event, Atlassian's leading minds presented groundbreaking, new
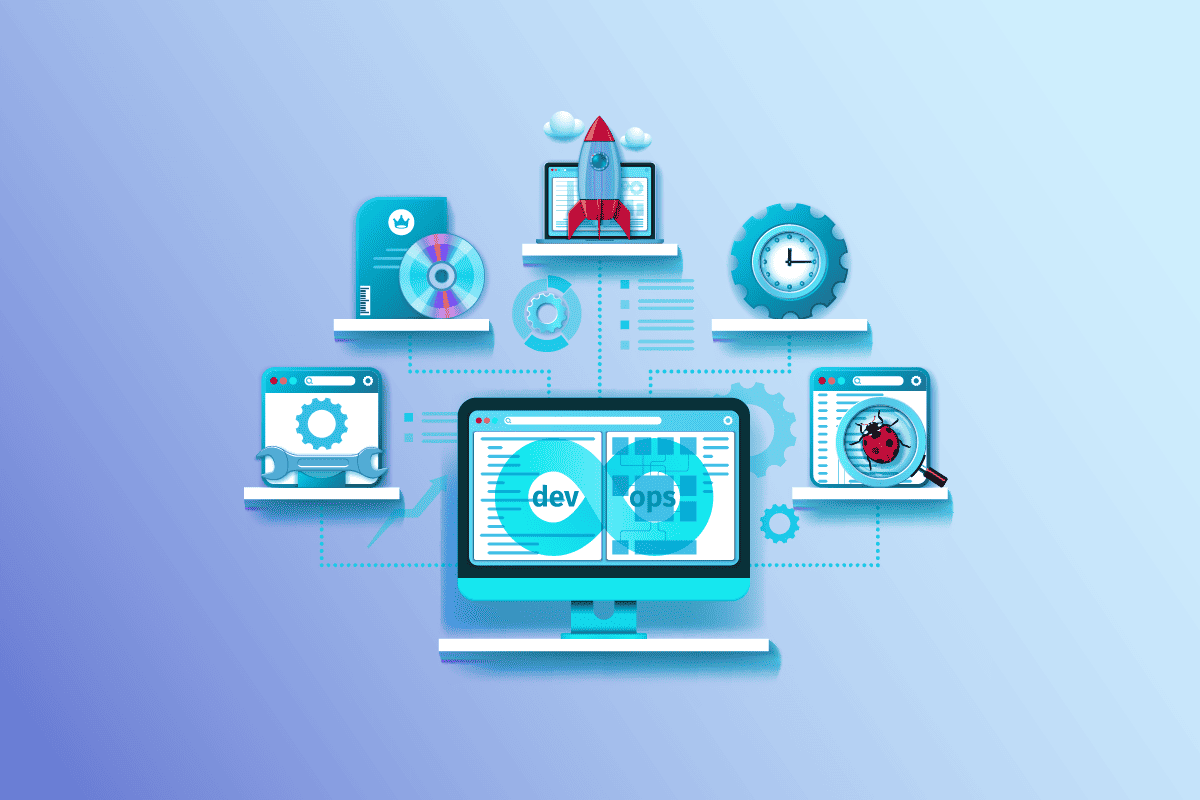
Deep Dive: Monitoring and Observability for DevOps Teams
Concepts, Best Practices, and Tools DevOps teams are under constant pressure to deliver high-quality software quickly. However, as systems become more complex and decentralized,
Advanced techniques for optimizing the CI/CD pipeline
Are you ready to revolutionize the way you develop and deploy software? Welcome to the world of DevOps, where development and
The role of security in successful DevOps implementation
DevOps is the interplay of people, processes and technology to continuously create value for customers. By bringing together development and operations teams and
How to deploy to production 100 times a day (CI/CD)
The success of a software company depends on its ability to deliver new features, fix bugs, and improve code and infrastructure in a short period of time. A
What is Infrastructure as Code (IaC)?
Infrastructure as Code describes the management and deployment of computer data centers through machine-readable definition files. Rather than using physical hardware configuration or interactive configuration tools. The
How to get started DevOps Automation and why it's important
DevOps automation enables faster and more consistent deployments, better tracking of deployments, and better control over the release process. In addition, DevOps automation can contribute to,
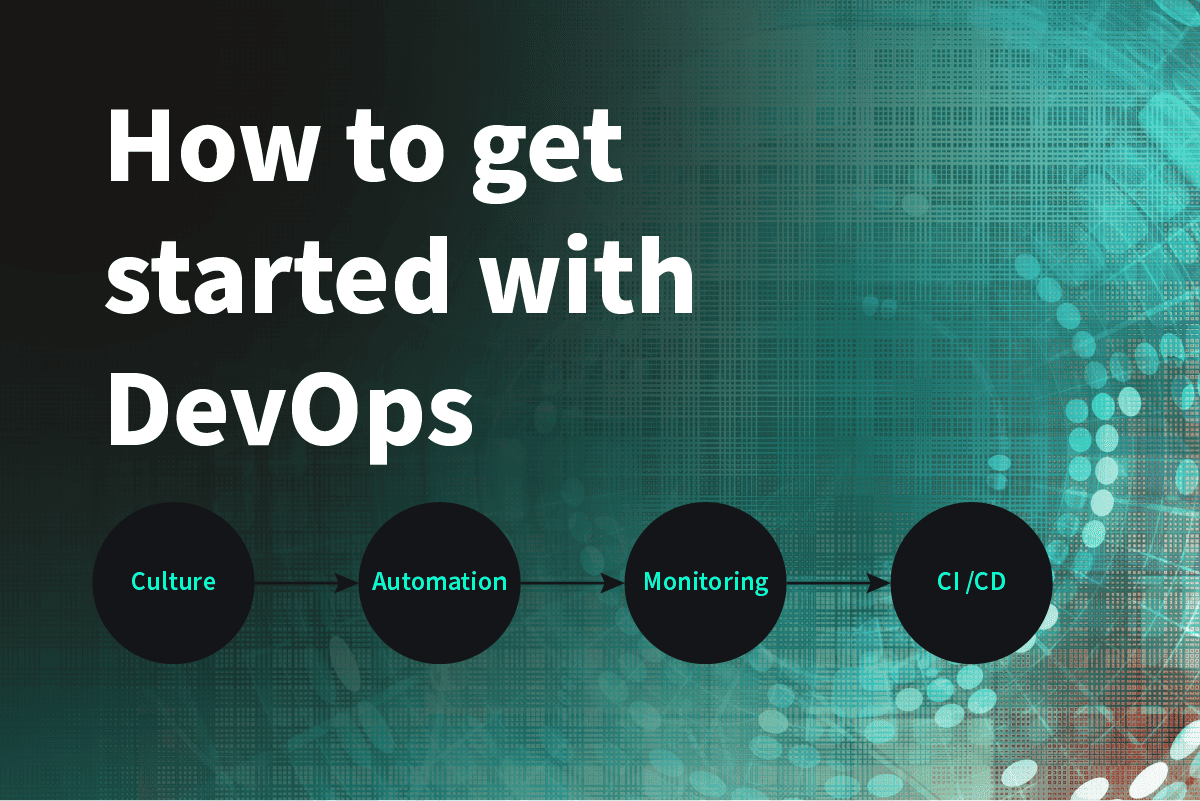
How to get started with DevOps
If you're new to DevOps, it can be overwhelming to know where to start. But fear not! In this post, we'll give you